

Purpose of monitoring
When operating a website on AWS, you might have questions like the following:
How many people are visiting my site day to day?
How can I track the number of visitors over time?
How will I know if the website is having performance or availability issues?
What happens if my Amazon Elastic Compute Cloud (Amazon EC2) instance runs out of capacity?
Will I be alerted if my website goes down?
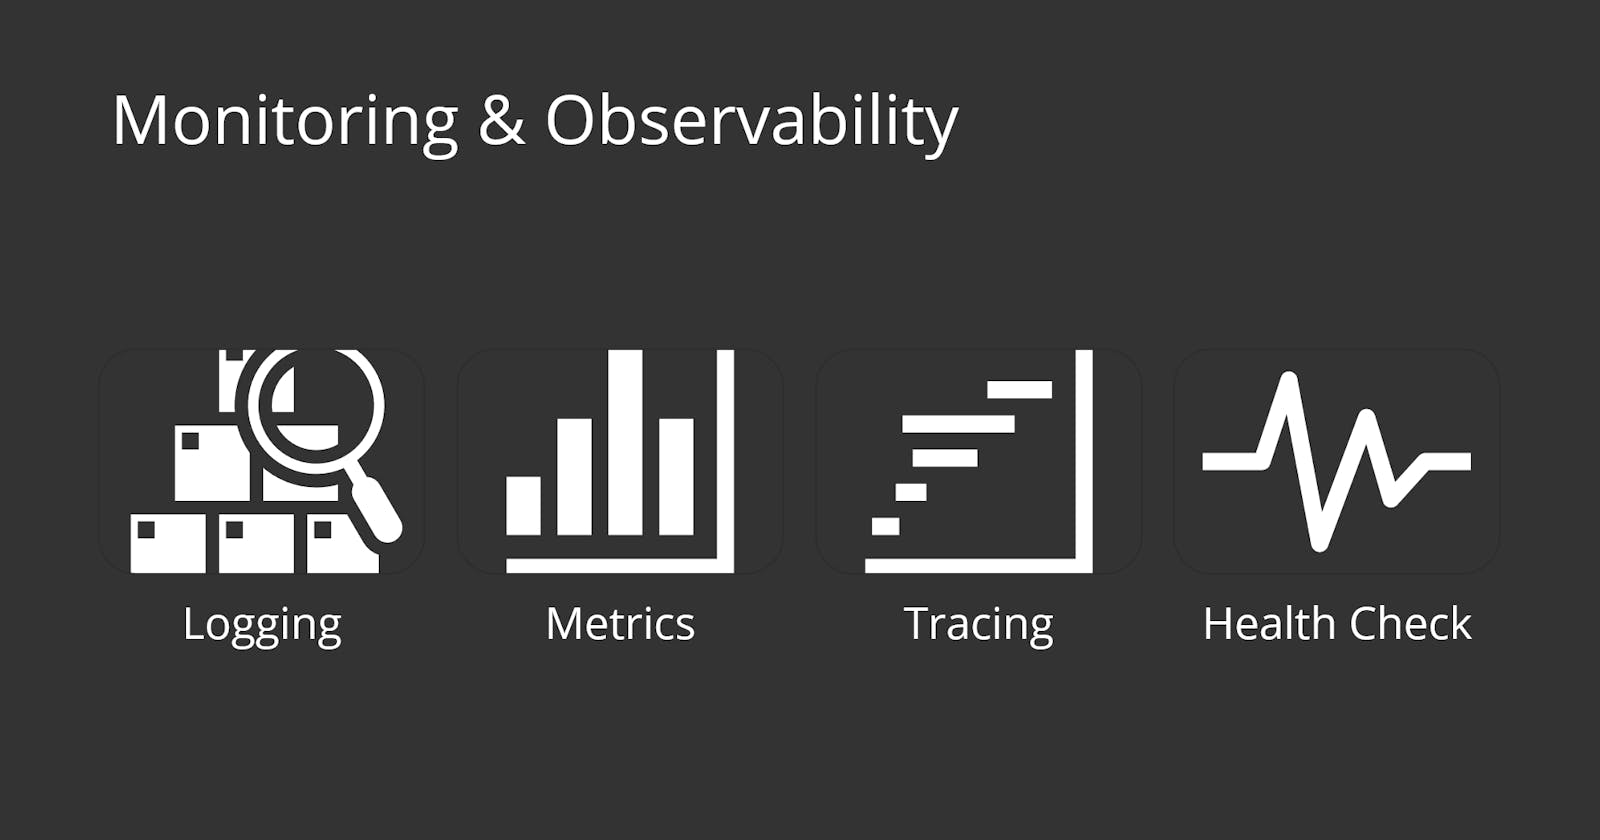
You need a way to collect and analyze data about the operational health and usage of your resources. The act of collecting, analyzing, and using data to make decisions or answer questions about your IT resources and systems is called monitoring.
Monitoring provides a near real-time pulse on your system and helps answer the previous questions. You can use the data you collect to watch for operational issues caused by events like overuse of resources, application flaws, resource misconfiguration, or security-related events. Think of the data collected through monitoring as outputs of the system, or metrics.
Use metrics to solve problems
The AWS resources that host your solutions create various forms of data that you might be interested in collecting. Each individual data point that a resource creates is a metric. Metrics that are collected and analyzed over time become statistics, such as average CPU utilization over time showing a spike.

One way to evaluate the health of an EC2 instance is through CPU utilization. Generally speaking, if an EC2 instance has a high CPU utilization, it can mean a flood of requests. Or it can reflect a process that has encountered an error and is consuming too much of the CPU. When analyzing CPU utilization, take a process that exceeds a specific threshold for an unusual length of time. Use that abnormal event as a cue to either manually or automatically resolve the issue through actions like scaling the instance.
CPU utilization is one example of a metric. Other examples of metrics that EC2 instances have are network utilization, disk performance, memory utilization, and the logs created by the applications running on top of Amazon EC2.
Types of metrics
Different resources in AWS create different types of metrics.
S3 metrics
RDS metrics
EC2 metrics
This is not a complete list of metrics for any of the services mentioned, but you can see how different resources create different metrics. You might be interested in a wide variety of metrics depending on your resources, goals, and questions.
Monitoring benefits
Monitoring gives you visibility into your resources, but the question now is, "Why is that important?" This section describes some of the benefits of monitoring.
Respond proactively
Improve performance and reliability
Recognize security threats and events
Make data-driven decisions
Create cost-effective solutions
Amazon CloudWatch

Visibility using CloudWatch
AWS resources create data that you can monitor through metrics, logs, network traffic, events, and more. This data comes from components that are distributed in nature. This can lead to difficulty in collecting the data you need if you don’t have a centralized place to review it all. AWS has taken care of centralizing the data collection for you with a service called CloudWatch.
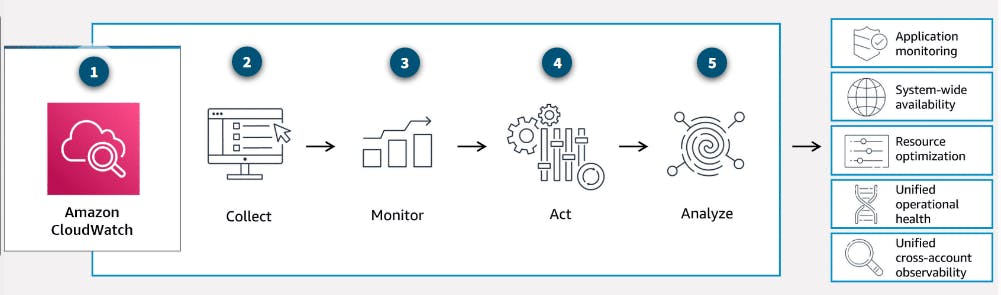
CloudWatch is a monitoring and observability service that collects your resource data and provides actionable insights into your applications. With CloudWatch, you can respond to system-wide performance changes, optimize resource usage, and get a unified view of operational health.
You can use CloudWatch to do the following:
Detect anomalous behavior in your environments.
Set alarms to alert you when something is not right.
Visualize logs and metrics with the AWS Management Console.
Take automated actions like scaling.
Troubleshoot issues.
Discover insights to keep your applications healthy.
How CloudWatch works
With CloudWatch, all you need to get started is an AWS account. It is a managed service that you can use for monitoring without managing the underlying infrastructure.
Many AWS services automatically send metrics to CloudWatch for free at a rate of 1 data point per metric per 5-minute interval. This is called basic monitoring, and it gives you visibility into your systems without any extra cost. For many applications, basic monitoring is adequate.
For applications running on EC2 instances, you can get more granularity by posting metrics every minute instead of every 5-minutes using a feature like detailed monitoring. Detailed monitoring incurs a fee.
CloudWatch concepts
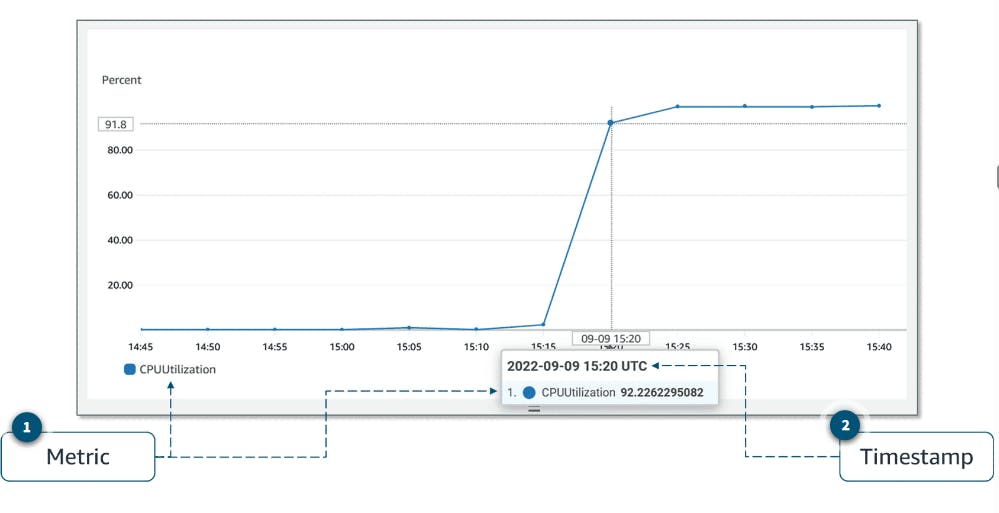
Metrics are the fundamental concept in CloudWatch. A metric represents a time-ordered set of data points that are published to CloudWatch. Think of a metric as a variable to monitor and the data points as representing the values of that variable over time. Every metric data point must be associated with a timestamp.
AWS services that send data to CloudWatch attach dimensions to each metric. A dimension is a name and value pair that is part of the metric’s identity. You can use dimensions to filter the results that CloudWatch returns. For example, many Amazon EC2 metrics publish InstanceId as a dimension name and the actual instance ID as the value for that dimension.

By default, many AWS services provide metrics at no charge for resources such as EC2 instances, Amazon Elastic Block Store (Amazon EBS) volumes, and Amazon RDS database (DB) instances. For a charge, you can activate features such as detailed monitoring or publishing your own application metrics on resources such as your EC2 instances.
Custom metrics
Suppose you have an application, and you want to record the number of page views your website gets. How would you record this metric with CloudWatch? First, it's an application-level metric. That means it’s not something the EC2 instance would post to CloudWatch by default. This is where custom metrics come in. With custom metrics, you can publish your own metrics to CloudWatch.
If you want to gain more granular visibility, you can use high-resolution custom metrics, which make it possible for you to collect custom metrics down to a 1-second resolution. This means you can send 1 data point per second per custom metric.
Some examples of custom metrics include the following:
Webpage load times
Request error rates
Number of processes or threads on your instance
Amount of work performed by your application
CloudWatch dashboards
Once you provision your AWS resources and they are sending metrics to CloudWatch, you can visualize and review that data using CloudWatch dashboards. Dashboards are customizable home pages you can configure for data visualization for one or more metrics through widgets, such as a graph or text.
You can build many custom dashboards, each one focusing on a distinct view of your environment. You can even pull data from different AWS Regions into a single dashboard to create a global view of your architecture. The following screenshot an example of a dashboard with metrics from Amazon EC2 and Amazon EBS.

CloudWatch aggregates statistics according to the period of time that you specify when creating your graph or requesting your metrics. You can also choose whether your metric widgets display live data. Live data is data published within the last minute that has not been fully aggregated.
You are not bound to using CloudWatch exclusively for all your visualization needs. You can use external or custom tools to ingest and analyze CloudWatch metrics using the GetMetricData API.
As far as security is concerned, with AWS Identity and Access Management (IAM) policies, you control who has access to view or manage your CloudWatch dashboards.
Amazon CloudWatch Log
CloudWatch Logs is centralized place for logs to be stored and analyzed. With this service, you can monitor, store, and access your log files from applications running on EC2 instances, AWS Lambda functions, and other sources.

With CloudWatch Logs, you can query and filter your log data. For example, suppose you’re looking into an application logic error for your application. You know that when this error occurs, it will log the stack trace. Because you know it logs the error, you query your logs in CloudWatch Logs to find the stack trace. You also set up metric filters on logs, which turn log data into numerical CloudWatch metrics that you can graph and use on your dashboards.
Some services, like Lambda, are set up to send log data to CloudWatch Logs with minimal effort. With Lambda, all you need to do is give the Lambda function the correct IAM permissions to post logs to CloudWatch Logs. Other services require more configuration. For example, to send your application logs from an EC2 instance into CloudWatch Logs, you need to install and configure the CloudWatch Logs agent on the EC2 instance. With the CloudWatch Logs agent, EC2 instances can automatically send log data to CloudWatch Logs.
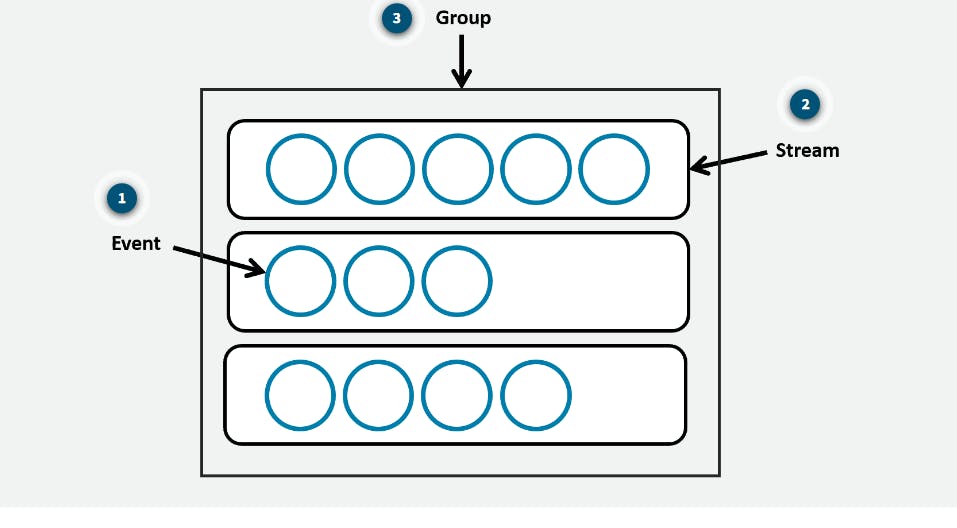
CloudWatch Logs terminology
Log data sent to CloudWatch Logs can come from different sources, so it’s important you understand how they’re organized.
CloudWatch alarms
You can create CloudWatch alarms to automatically initiate actions based on sustained state changes of your metrics. You configure when alarms are invoked and the action that is performed.
First, you must decide which metric you want to set up an alarm for, and then you define the threshold that will invoke the alarm. Next, you define the threshold's time period. For example, suppose you want to set up an alarm for an EC2 instance to invoke when the CPU utilization goes over a threshold of 80 percent. You also must specify the time period the CPU utilization is over the threshold.
You don’t want to invoke an alarm based on short, temporary spikes in the CPU. You only want to invoke an alarm if the CPU is elevated for a sustained amount of time. For example, if CPU utilization exceeds 80 percent for 5 minutes or longer, there might be a resource issue. To set up an alarm you need to choose the metric, threshold, and time period.
An alarm can be invoked when it transitions from one state to another. After an alarm is invoked, it can initiate an action. Actions can be an Amazon EC2 action, an automatic scaling action, or a notification sent to Amazon Simple Notification Service (Amazon SNS).